Introduction
Frontend performance optimization is a crucial aspect of delivering a smooth user experience. However, many fresh graduates and developers new to Vue.js may struggle with identifying performance bottlenecks and optimizing their applications efficiently.
In this case study, we will explore:
- The performance pitfalls encountered in a Vue.js project.
- The tools and techniques used to diagnose and resolve these issues.
- Lessons learned from our experience.
Background
Our team was new to frontend development, and this was our first time using the Vue.js framework for a large-scale project.
Throughout the development process, we encountered numerous errors and struggled with performance issues. Through extensive trial and error, we managed to diagnose and fix these problems. This article documents some of our learnings, focusing on frontend performance tuning.
Performance Tuning Tools
1. Chrome DevTools
Chrome DevTools provides a powerful suite of tools for analyzing and optimizing web applications.
Key Features Used:
- Performance Tab: Helps identify slow functions and bottlenecks.
- Memory Tab: Detects memory leaks and excessive memory usage.
- Network Tab: Monitors API requests, responses, and WebSocket updates.
Example:
Let’s look at how we can identify performance bottlenecks using the Performance tab. Here’s a simple example of a long-running task:
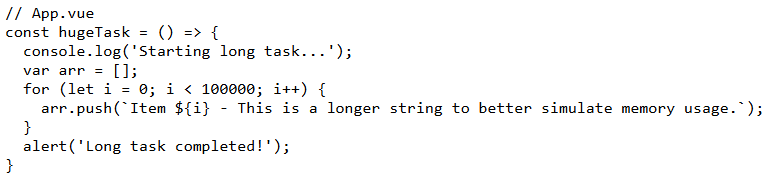
In the recording, you can see:
- The long-running task blocking the main thread
- The exact duration of the task
- When the UI becomes unresponsive
This helps us identify:
- Which functions are taking too long
- Where the main thread is being blocked
- Areas that need optimization
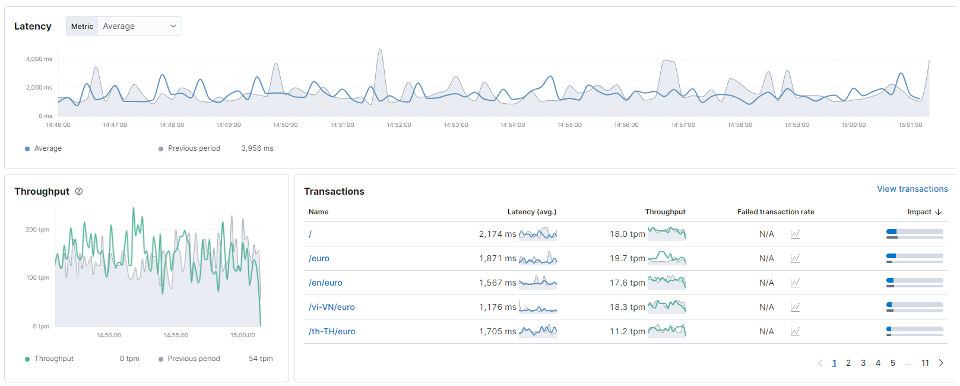
2. RUM.js (Elastic APM)
Real User Monitoring (RUM) allows us to track frontend performance metrics in real-time.
How it helped:
- It provided insights into page load times and function execution times.
- We used APM logs to analyze user interactions and pinpoint slow-performing routes.
Performance Pitfalls in Vue.js
1. setInterval Misuse
When using setInterval in Vue components, failing to clear intervals upon component destruction can cause memory leaks and performance issues.
❌ Problematic Code Example:
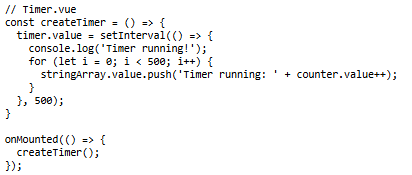
This code creates a timer that:
- Runs every 500ms
- Adds 500 new strings to an array each time
- Never cleans up when component is unmounted
- Can cause memory leaks and performance degradation
You may notice that after deleting the component, the timer is still running. Imagine this timer runs a heavy task.
🛠 Vue 3 Solution: useIntervalFn
Vue 3’s Composition API provides a cleaner approach using useIntervalFn from @vueuse/core:

⚠️ Before we fixed the issue: Users reported their browsers would freeze completely after using the application for 10-15 minutes. Investigation revealed that each time the component was mounted and unmounted, a new interval was created but never cleared. These zombie intervals continued running in the background, consuming CPU cycles and memory, eventually bringing the browser to a crawl.
📊 Performance Impact: In our testing, after just 20 component remounts, memory usage increased by 300MB and CPU utilization spiked to 90% during interval executions.
👉 useIntervalFn ensures the interval is automatically cleaned up when the component is destroyed, preventing memory leaks and maintaining consistent performance over time.
2. Event Handlers Not Removed
Event listeners attached to global objects (like window or document) must be properly removed when the component is destroyed.
❌ Problematic Code Example:
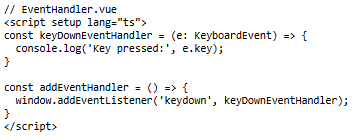
This code:
- Adds event listeners but doesn’t clean them up automatically
- Can cause memory leaks if component is unmounted without calling clearEventHandler
- May lead to duplicate event handlers if component is remounted
⚠️ Before we fixed the issue: Similar to our interval problem, users experienced severe performance degradation after navigating through multiple pages. Each time a component with event listeners was mounted and unmounted, the listeners remained attached to the global window object. This resulted in duplicate event handlers being triggered for every user interaction, causing input lag and eventually browser crashes.
📊 Performance Impact: In our real prod case, with just 50 component remounts, we observed keyboard input delays increasing from 5ms to over 200ms, making the application virtually unusable.
🛠 Vue 3 Solution: useEventListener
We can use useEventListener from @vueuse/core to manage event listeners automatically:
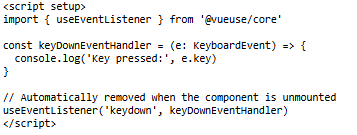
👉 useEventListener handles event listener removal for us, avoiding memory leaks.
Lessons Learned
✅ Common Frontend Performance Pitfalls:
- Unoptimized WebSocket or API calls.
- Memory leaks due to lingering intervals or event listeners.
- Inefficient rendering due to excessive state updates.
🛠 Tools That Helped:
- Chrome DevTools for profiling and debugging.
- APM tools (RUM.js) for real-time performance monitoring.
- VueUse utilities (
useIntervalFn,useEventListener) to handle common issues efficiently.
By applying structured debugging techniques and using the right tools, we significantly improved the performance of our Vue.js application.
Conclusion
Performance tuning is an iterative process that requires a deep understanding of your application’s behavior. By leveraging the right tools and following best practices, developers can efficiently diagnose and resolve frontend performance issues.
🔹 Key Takeaways:
- Always profile your application before optimizing.
- Use Chrome DevTools and APM tools to gain insights.
- Avoid common pitfalls like uncleared intervals and dangling event listeners.
- Leverage VueUse utilities for better state management and cleanup.
We hope this case study provides valuable insights into Vue.js performance tuning for fresh graduates and new developers. 🚀
Happy coding!
